Big Get Bigger
Overall, Distribution Giants reports from 2016-2025 (covering year-end sales from 2015-2024) show that sales volume generated by the Top 100 dealers has nearly doubled over the past decade to reach $15.74 billion. Along the way, the profile of the group has evolved significantly, with the gap in 2024 sales between the largest company, at $3.6 billion in volume, and the smallest, at $6.3 million, the widest in at least a decade — in fact, more than three times wider. In the FE&S 2016 Distribution Giants study, the gap between sales for the No. 1 and No. 100 companies in 2015 was $1.153 billion; in this year’s study, based on 2024 sales, the gap is $3.633 billion.
In just 2 of the past 10 years — 2020, during the pandemic, and 2024, a year marked by economic and election uncertainty — did the group as a whole grow by less than 5%. And in all but three years (2017, 2020 and 2024), more than 2 out of 3 dealerships recorded sales increases. If looked at as a unit, acknowledging the fact that the makeup of the group inevitably changes slightly from year to year due to mergers, acquisitions and, in some cases, business closures, the Distribution Giants achieved a compound annual growth rate of 7% in the decade.
In 2025, of the 80 companies in the Distribution Giants study that provided 2024 sales information by segment, nearly three-quarters volume was done in commercial foodservice segments, primarily with independent operators. Those ratios have remained stable over the past few years. In 2020, when 82 companies provided such information based on 2019 sales, 76% of volume was to commercial operators — 36% to chains, 64% to independents.
Top 100 Distribution Giants
10-Year Sales History
Total sales among the Top 100 have grown immensely, with the data showing how the big have gotten bigger over the years.
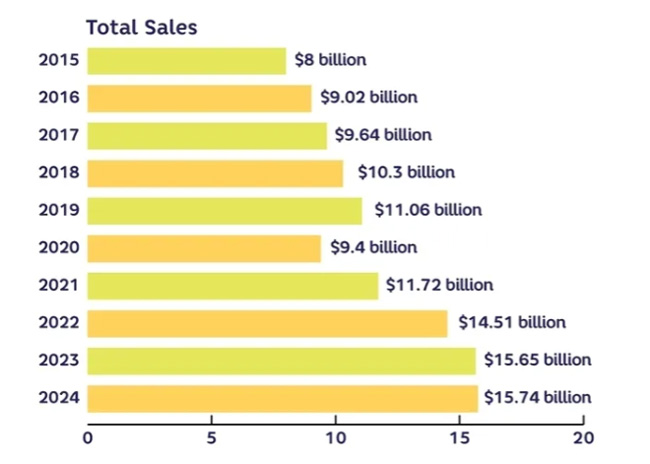
Source: FE&S Distribution Giants studies, 2016-2025
Sales by Market Segment
The bulk of sales among the Top 100 Distribution Giants stems from commercial accounts and largely independent operators.
| Sales | 2024* | 2019** |
|---|---|---|
| Commercial...................... | 74% | 76% |
| Chain......................... | 30% | 36% |
| Independent........... | 70% | 64% |
| Noncommercial................ | 26% | 24% |
*80 companies provided sales by segment information
**82 companies provided sales by segment information
>3X
The gap in sales between the largest and smallest Distribution Giants companies has more than tripled since 2016, reaching $3.633 billion based on 2024 sales.
Snapshot
Performance at a more individual level within the Top 100, however, varies widely and the data show an irrefutable truth: The big are considerably bigger while many of the industry’s mid-sized and smaller players struggle to survive, much less grow.
Take the most recent snapshot. All but 2 of the 2025 Top 10 dealers (TriMark USA, down 4.38%, and Wasserstrom down 2.78%) reported or were estimated to have had sales gains from 2023 to 2024. As a group, the Top 10 increased year-over-year sales in 2024 by 5.24% to $11.24 billion, outperforming the overall gain of 3.84% for the Top 100. Each of those 10 largest firms’ sales volumes now far exceeds $300 million and each of the top 3 companies now far surpasses $1 billion in sales. The top 3 together — Clark Associates, TriMark USA and Edward Don & Co. — today represent sales volume approaching $8 billion. And No. 1 Clark’s 2024 sales alone, $3.69 billion, exceed the combined volume of all 85 companies ranked from No. 15 through 100 based on 2024 sales.
While year-to-year swings can sometimes be dramatic in either direction, a look farther back shows how the industry’s leading equipment and supplies dealers have fared more broadly, on a compound annual growth rate basis. Together, this year’s Top 10 have shown CAGR over the past 10 years of 9.51%. Individually, their growth rates vary considerably, some might say from relatively sluggish to sizzling.
Top 10 Distribution Giants 2025
| 2025 FE&S Distribution Annual Sales | Giants Rank year-end 2024 in millions |
|---|---|
| 1. Clark Associates Inc. | $3,639.20 |
| 2. TriMark USA Inc. | $2,271.00 |
| 3. Edward Don & Co. | $1,630.00* |
| 4. Singer Equipment Co. | $865.40 |
| 5. Wasserstrom Co. | $716.00 |
| 6. KaTom Restaurant Supply Inc. | $483.79 |
| 7. Johnson-Lancaster and Associates Inc. | $427.50 |
| 8. Bargreen Ellingson Inc. | $420.00 |
| 9. Stafford-Smith Inc. | $393.63 |
| 10. Boelter | $391.50 |
*FE&S estimate
CAGR Top 10
Collectively, the 2025 Top 10 Distribution Giants achieved a 10-year compound annual growth rate of 9.51%, outperforming the overall Distribution Giants CAGR of 7%.
| 2025 FE&S Distribution Giants Rank | 2015-2024 CAGR |
|---|---|
| 1. Clark Associates Inc. | 19.12% |
| 2. TriMark USA | 6.90% |
| 3. Edward Don & Co. | 7.51%* |
| 4. Singer Equipment Co. | 12.49% |
| 5. Wasserstrom Co. | 1.13% |
| 6. KaTom Restaurant Supply Inc. | 21.19% |
| 7. Johnson-Lancaster and Associates Inc. | 14.67% |
| 8. Bargreen Ellingson Inc. | 6.58% |
| 9. Stafford-Smith Inc. | 10.18% |
| 10. Boelter | 2.43% |
*FE&S estimate for 2023, 2024