A look back to the 2019 performance of the top 1,000 chains might provide some guidance on what’s to come.
As the restaurant industry continues to wonder what performance will be like in 2021, a look back to the 2019 performance of the top 1,000 chains might provide some guidance on what’s to come.
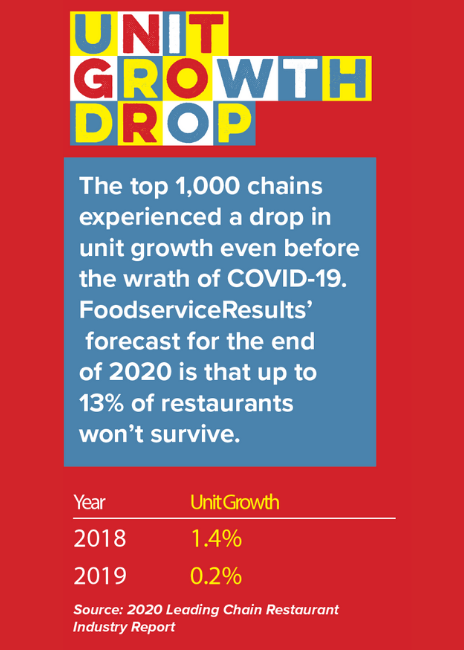
Take systemwide sales and unit growth, for example. Sales among the top 1,000 chains grew at a rate of 3.1% and 3.2% annually in 2018 and 2019, according to the 2020 Leading Chain Restaurant Industry Report published by FoodserviceResults. While revenues were relatively consistent over that two-year period, the top 1,000 chains struggled to grow their overall unit count. In 2018, the top 1,000 chains saw unit count grow by 1.4%, but that dropped to 0.2% in 2019.
Heading into 2020, the forecast in terms of sales remained steady at 3.1%, but it was to be difficult year for unit growth, which was projected at 0.3%. Undoubtedly, COVID-19 dealt a damaging blow to even the most modest growth numbers. “Looking at these groupings as a whole, chain restaurants are struggling,” says Darren Tristano, founder of FoodserviceResults. “And unless you are one of the big guys, you are likely closing stores.”
Fault Line
A closer look at the top 1,000 chains shows a significant fault line developing between the first 500 companies and the second 500 companies. The top 500 chains saw sales increase by 3.6% or $331.6 billion, per the 2020 Leading Chain report. In contrast, chains 501 to 1,000 saw sales increase 0.5% or $16.7 billion.
A quartile analysis of the top chains’ revenue provides an even more telling picture of the multiunit market. Chains 1 to 250 saw revenues increase by 3.4% in 2019, per the 2020 Leading Chain report. Chains 251 to 500 realized 1.9% in revenue growth. Chains 501 to 750 saw revenues grow just 0.2%, while chains 751 to 1,000 saw a 1.2% increase in sales.
In other words, outside of the top 250, the remaining chains lost money in real terms in 2019, Tristano notes.
The developing growth story reflected in the report does not stop with revenues. Looking at unit count, the top 500 realized a 0.4% increase in 2019 compared to a 3.1% decline for chains 501 to 1,000. A deeper dive into unit count shows the top 250 chains saw locations grow by 0.5% in 2019. In contrast, chains 251 to 500 saw a 1.1% decline in units, 501 to 750 saw a 3.4% decline in units and 751 to 1,000 saw a 2.5% decline in unit count.
In other words, the big chains keep strengthening their position, thus reversing a recent trend. “Years ago, it was the mid to small chains outpacing the large ones. Everyone wanted local, smaller chains,” Tristano says. “But now it’s the larger chains that are growing. They have the capital, advertising and the loyalty. Those are the chains that have the ability to absorb shares from closed units. So, the top brands continue to be dominant.”
Looking ahead, it would appear restaurant unit count remains ripe for further contraction. “I would expect unit decline even among the top 500 chains,” Tristano adds. “And I would have expected that regardless of the pandemic because there are too many units. There are chains adding units in the U.S. Some chains have recognized they have too many units and started closing them. The pandemic served to accelerate the process. As a result, we will likely see much steeper declines among the top 500 or 1,000 chains. For some chains, it’s not a question of pruning but of stopping the bleeding.”
One significant challenge many chains face is the fact that much of their unit base operates from downtown or central business districts. These areas continue to struggle with foot traffic as people continue to work from home due to COVID-19 and the social unrest that led to various demonstrations. “You are going to see fewer residents in the urban markets going out to eat. Then you start to look at the market from the workplace point of view. Most of these locations are barely seeing 20% to 30% of what they were seeing before the pandemic,” Tristano says. “And many can’t survive because of the higher rents that are common for these urban markets.”
The view from the suburbs, however, differs from that in the city. “In the suburban markets you are getting your typical business plus the work-at-home business, particularly, if you have a
drive-thru component,” Tristano notes.
 Supply-Demand Harmony
It would be very easy to blame the pandemic for the tighter growth environment of chains, but that outlook is overly simplistic. “When we look at last year, pre-pandemic, we saw an overall market saturation among both chains and independents,” Tristano says. “The chains have fared better because of their strengths, and even more so for the larger chains. We are starting to see the industry getting closer to equilibrium, which gets us closer to harmony in terms of supply and demand.”
With respect to how these factors combined will affect the overall performance of the top 1,000 chains, Tristano offers his projections. Originally, FoodserviceResults forecast a growth rate of 3% for the top 1,000 in 2020. Now? “We will likely see a decline of 30% to 35%. That’s a huge swing. And 12% to 13% of these restaurants can’t survive this,” he says. “Those who do survive will benefit in the long run. When you look at the independent market, it will get harder because they typically don’t have the resources chains have. They can’t afford the real estate or manage the labor with such a low demand for food.”
Indeed, Tristano believes that chains have several attributes working in their favor for the time being. “If you were going to a chain already, you are likely to choose another one for reasons like price, convenience, etc.,” he says.